
.png)
Two weeks ago I ran a $3 million retirement through the 4% rule and it came out at 5.6%. Well over the line. I said I'd keep going anyway.
Today I will show you why.
Almost every simple retirement calculation makes the same assumption. You spend $200,000 this year, inflation runs 3%, so next year you spend $206,000, then $212,180, and on it goes for 30 years.
By year 25 that's over $400,000 a year, and your portfolio has to fund every dollar of it.
The inflation piece sounds reasonable in theory. It just doesn't match how households actually spend in my experience with working with retired attorneys.
Research from Ty Bernicke, and later from David Blanchett at Morningstar, traced real household spending through retirement and found a curve.
Spending runs high in the early years, when you're healthy and finally have time to use. It settles down through the middle stretch. Then it turns back up late, mostly on health care.
Draw it out and it looks like a smile.
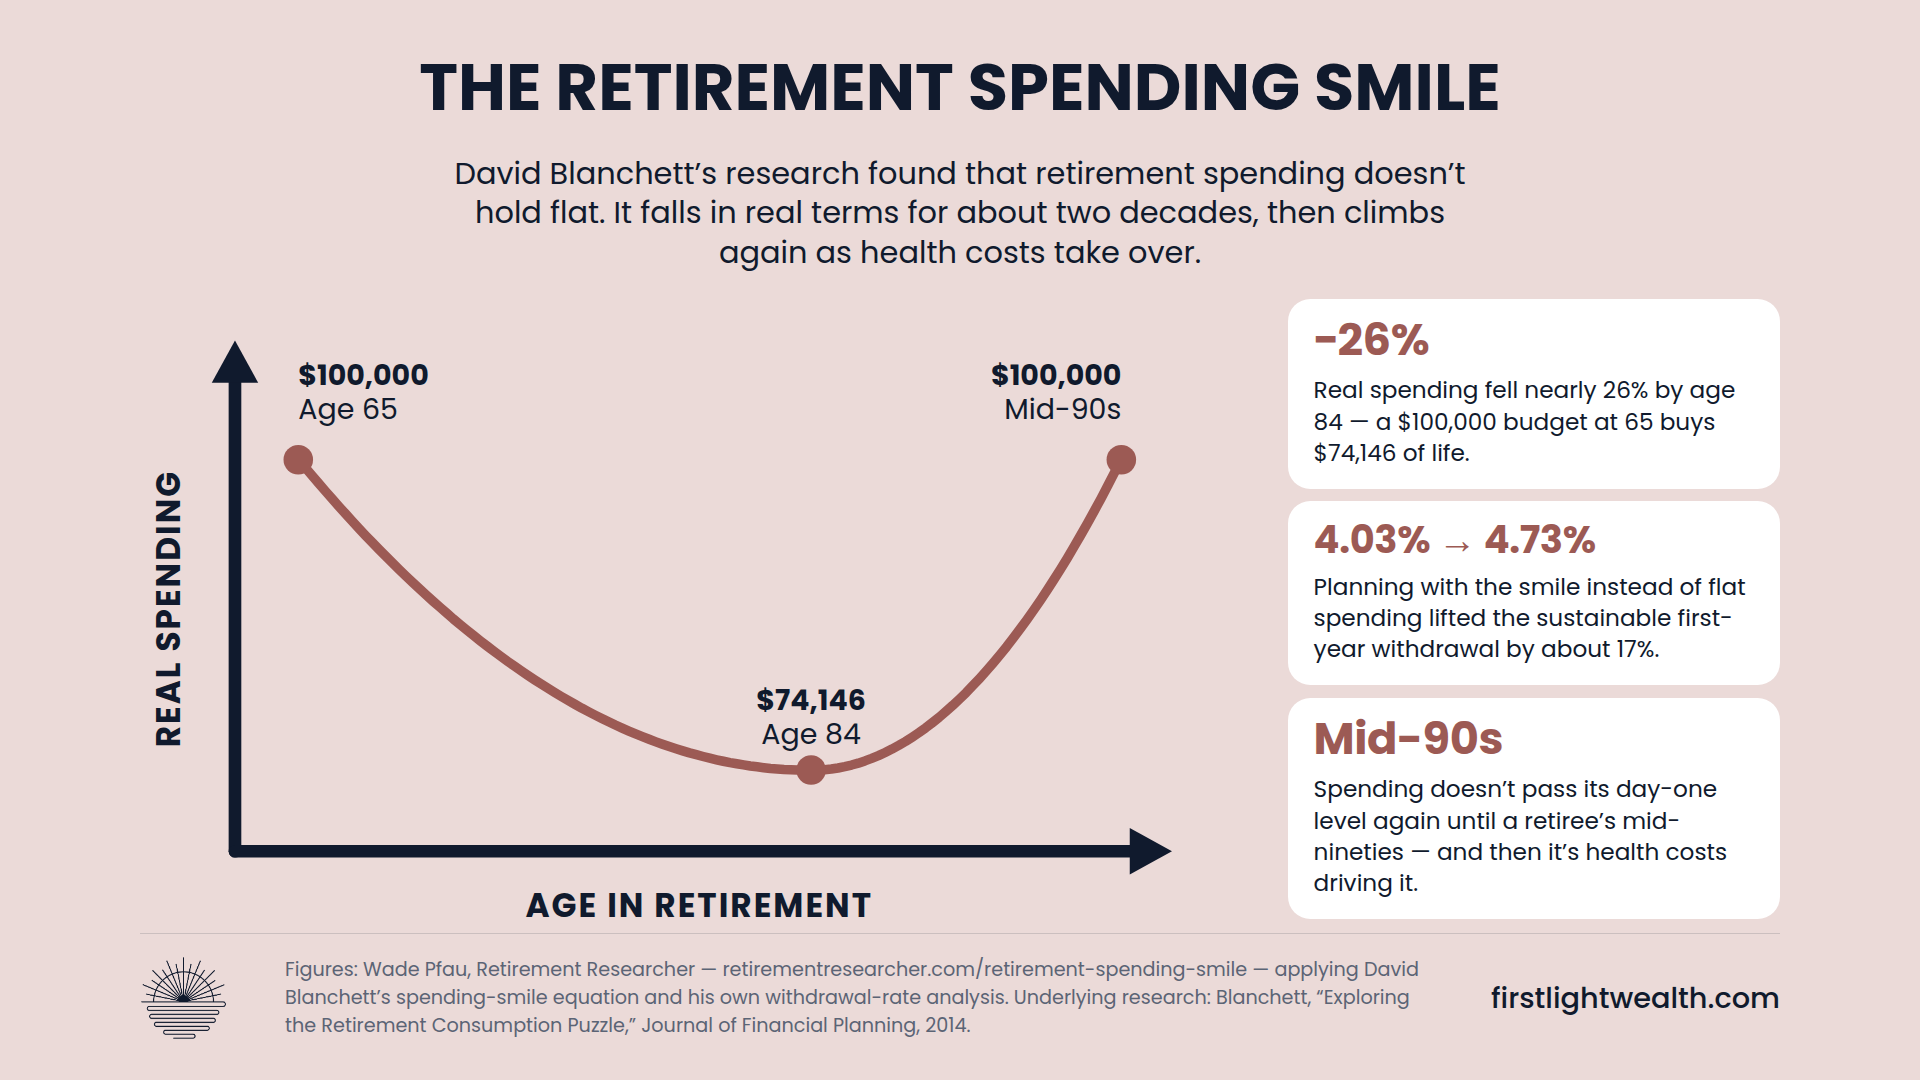
In practical terms, if you're planning for general inflation of 3%, retirement spending for many households may only be climbing around 2%.
That gap sounds small. Compounded across a retirement, it's enormous.
A plan built on 3% forever has to fund a spending number that keeps sprinting away from you. A plan built on 2% through the middle years, with a deliberate bump late for health costs, has a much smaller finish line to reach. On a $200,000 starting number, the difference by year 25 is roughly $80,000 a year of spending the plan no longer has to produce.
Same portfolio. More room to spend in the years you're most able to enjoy it.
Planning around the smile can support a higher withdrawal in year one, which happens to be exactly when you want the money.
A withdrawal rate is one number applied to 30 years. A Monte Carlo simulation runs your plan through 1,000 different market outcomes and reports how many of them you finish with money left over. That's your probability of success.
The more useful part is everything the model can hold that a percentage can't. Your mortgage falling off in year 7. The practice buyout ending in year 5. Social Security switching on at 70. Spending that follows the smile.
None of that fits inside a single number.
Two cautions, because I've always promised honesty.
The late-life increase is real, and for some households it's severe. Planning for gentle 2% inflation while ignoring what long term care can cost is how a decent plan breaks in year 22.
And this curve is an average across a lot of households. Yours depends on your health, your travel habits, and whether you're supporting anyone else. It's a better starting assumption than a flat 3%, and it's still an assumption.
If you're also willing to adjust your spending when markets misbehave, that flexibility stacks right on top of this. I went deeper on that piece in dynamic spending.
Your plan should bend where your life bends. A straight line never does.
Next week I'll close this series out with a retirement move that has more impact than anything I’ve written about today, which is going from full-time work to 3 days a week instead of stopping cold.
If you want to see your own plan run through a few thousand market scenarios, you can schedule a call here.

Financial Advisor


Financial planning & investment management services for families & businesses
📍405 E Chocolate Ave, Suite 101 A, Hershey, PA 17033
Serving clients virtually nationwide